
Documentation / Costs, invoices and reports
Reports
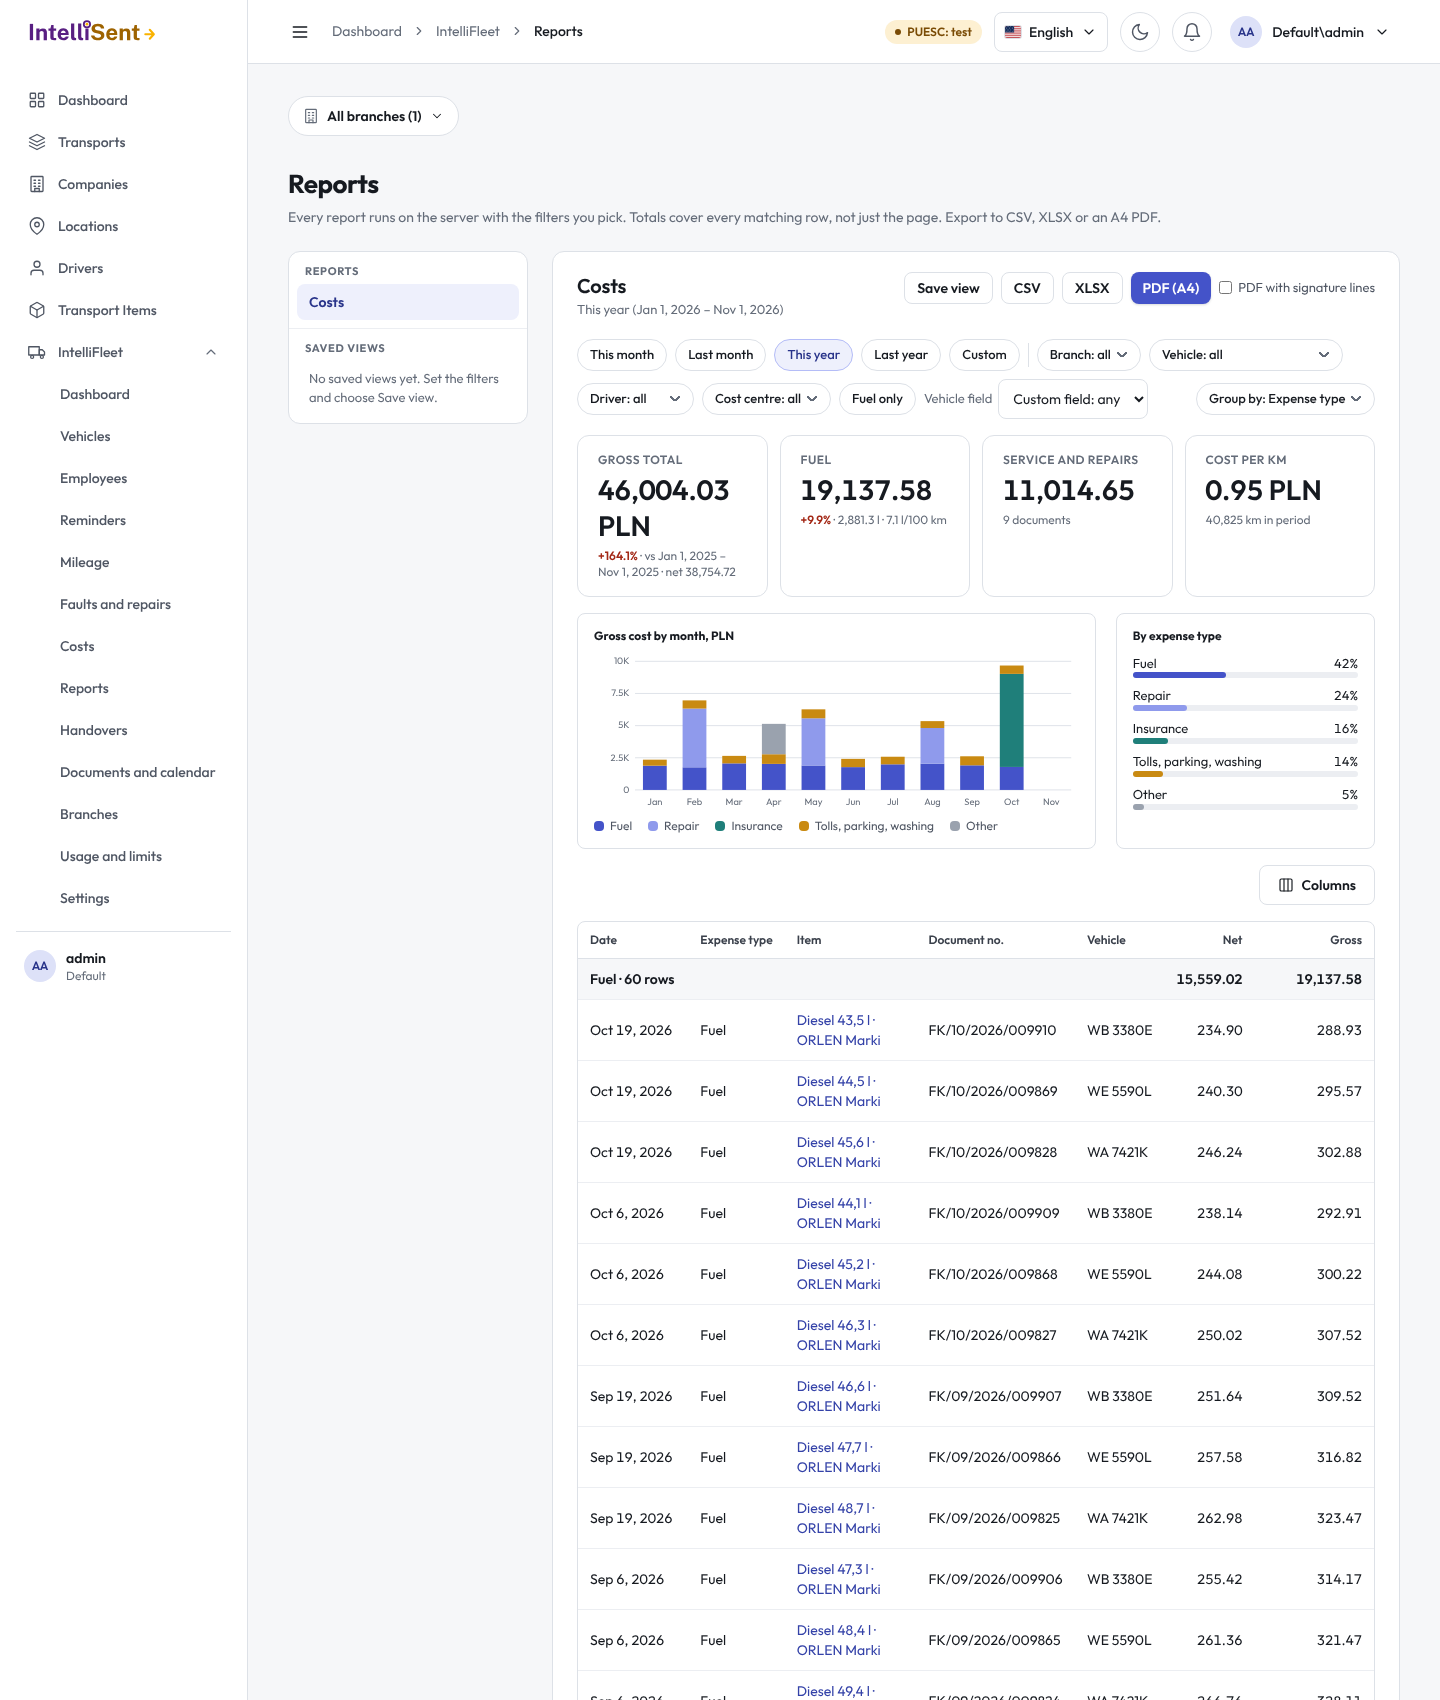
IntelliFleet > Reports lists the reports on the left and opens the one you pick on the right. Each report runs on the server with the filters you set, so its totals always cover every matching row, not just the page you are looking at. The first report is Costs; more join the list as they are built. Every report has the same frame: filter bar, tiles with the change from the period before, one chart, a sortable and groupable table with subtotals and totals, and export.
Who can see them
Each report needs the permission of its area (in Administration > Roles, under IntelliFleet): Costs for the Costs report and Work orders and settlements, Mileage for Trips and mileage and Road cards, Fuel for Fuel consumption and Fuel prices, Equipment and tyres for Tyres. The list shows only the reports you may open. As everywhere in IntelliFleet, you see only vehicles in the branches you have access to, and the Branch and Fleet picked in the header narrow the report.
The Costs report
The Costs report brings together every cost of the Costs area: expenses, fuel entries, tyre sets, repairs and work settlements. A cost is net + the VAT that cannot be deducted, worked out the same way as on the Costs list. A cost counts in the branch its vehicle belonged to on the cost date.
Filters
- Period: This month, Last month, This year, Last year or a Custom period with From and To dates.
- Vehicle, Driver, Cost centre, Fuel card and Road card.
- Fuel only keeps the fuel entries and fuel purchases.
- Currency: the report adds up one currency at a time; it starts with your company's currency.
- Custom fields: pick a field of the vehicle, the driver, the expense or the repair and the value it must have (for a number or a date, a from–to range).
Tiles and chart
Four tiles sum up the period: Gross total (with the net amount), Fuel (with litres and, when the odometer readings allow it, litres per 100 km), Service and repairs (with the number of repairs) and Cost per km (the cost divided by the kilometres driven by the vehicles in the report, from their odometer readings). Each tile shows the change from the period before: the same months a year earlier for a year, the month before for a month, and the same number of days just before for a custom period.
The chart shows the gross cost of each month, stacked by expense type: the four biggest types, the rest as Other.
Table
- Click a column header to sort by it; click again to reverse, a third time to go back to latest first.
- Group by a column (expense type, vehicle, driver, branch, fleet, cost centre, month, a custom field…) to see each group with its subtotal. The subtotals and the total row come from the server and cover every row of the report. Click a group's name to fold its rows away and click it again to show them; the subtotals stay, and opening another grouping shows every group again.
- Columns lets you choose which columns are shown and in what order, custom fields included.
- Click a row's link to open the expense, settlement or repair it comes from; a fuel entry or a tyre set opens its vehicle's card.
Export
Export the report as CSV, XLSX or PDF (A4). The file holds every matching row (not just the page) with the columns you see, the groups and subtotals, and the total. The PDF lists the filters at the top and numbers its pages; tick PDF with signature lines to add "Issued by" and "Approved by" lines at the end.
Saved views
Click Save view to keep the filters, grouping, sort and columns under a name. Your views are listed under Saved views on the left; only you see them. Click a view to open it. The star marks the view that opens first when you come to the report. A view with a preset period (for example This year) works the period out again each time you open it.
E-mail a view on a schedule
Open one of your saved views and click E-mail on a schedule to have it sent to you and colleagues:
- How often: every day, every week on a day you pick, or every month on a day you pick (a day the month does not have, such as the 31st, sends on its last day).
- At: the time of day in your company's time zone (the one set in the company settings).
- PDF, XLSX or both: the files are the same as Export gives, with the view's columns and filters.
- Send to: any active users of your company. Add yourself to get it too.
The period is worked out again at each send, so a view with Last month always sends the month before. The report is made with your permissions and branch access, whoever receives it: a colleague never gets more than you may see, and the e-mail says whose view it is.
Your schedules are listed under Scheduled e-mails on the left, with when each sends next. Pause stops one until you Resume it; the bin deletes it. Deleting the view deletes its schedule. Saving the view again (Update view) keeps the schedule and takes the view's new columns.
If a send fails, it is tried again twice (after 15 and 30 minutes); then you get a notification and the next send goes as planned. You also get a notification when the company's e-mail allowance is used up (see Usage and limits) or when you may no longer open the report; that send is skipped. A schedule stops for good when its owner is no longer an active user.
Trips and mileage
Trips and mileage replaces the old reports of a vehicle's trips, a driver's trips and a vehicle's mileage history: pick the vehicle or the driver in the filter bar. It has two views, picked with the chips at the left of the filter bar.
- Trips lists the trips of the Mileage area: date, vehicle, driver, purpose, route, business or private, kilometres, and for business trips the rate per km and the amount they were settled with. The four tiles show the Kilometres, the Business and Private shares of them, and the Mileage allowance (with the amount per business km). The chart stacks each month's kilometres, business against private. Filter by Usage to keep only business or only private trips.
- Odometer readings lists the odometer history of the vehicles, including the readings taken at handovers, with the source of each reading and the kilometres since the vehicle's reading before it (which may lie before the period). Its tile and chart add up those kilometres.
The amounts are in one currency at a time, as in the Costs report. Everything else works as in the Costs report: period presets, branch and fleet, grouping, columns, custom fields of the vehicle, export and saved views. Saved views of this report are in the Saved views list above the filter bar.
Road cards
Road cards lists the road cards issued in the period for the vehicles you may see: issue date, card number, vehicle, driver, purpose, route, the kilometres between the card's odometers and the driving, rest and working hours it records. The tiles show the number of Road cards, the Kilometres (with the average per card), the Driving time and the Working time (with the rest time); the chart stacks each month's kilometres by vehicle. Filter by vehicle and driver. Click Print beside a card's number to download its PDF, the same road card the Mileage screen prints. Needs the Mileage permission.
Work orders and settlements
The default view lists the Settlements of the Costs area, dated by their last day: order, vehicle, employee, customer, type of work, hours, rate per hour and the amount (hours × rate, no VAT). The Work orders view lists the orders that overlap the period with the number of settlements, hours and amount they add up to; Print beside an order downloads its PDF. The tiles show the number of rows, the Hours and the Amount (with the amount per hour); the chart stacks the amount by type of work. An order without a vehicle appears only while the report is not narrowed to a vehicle, branch or fleet. The amounts are in one currency at a time. Needs the Costs permission.
Fuel consumption
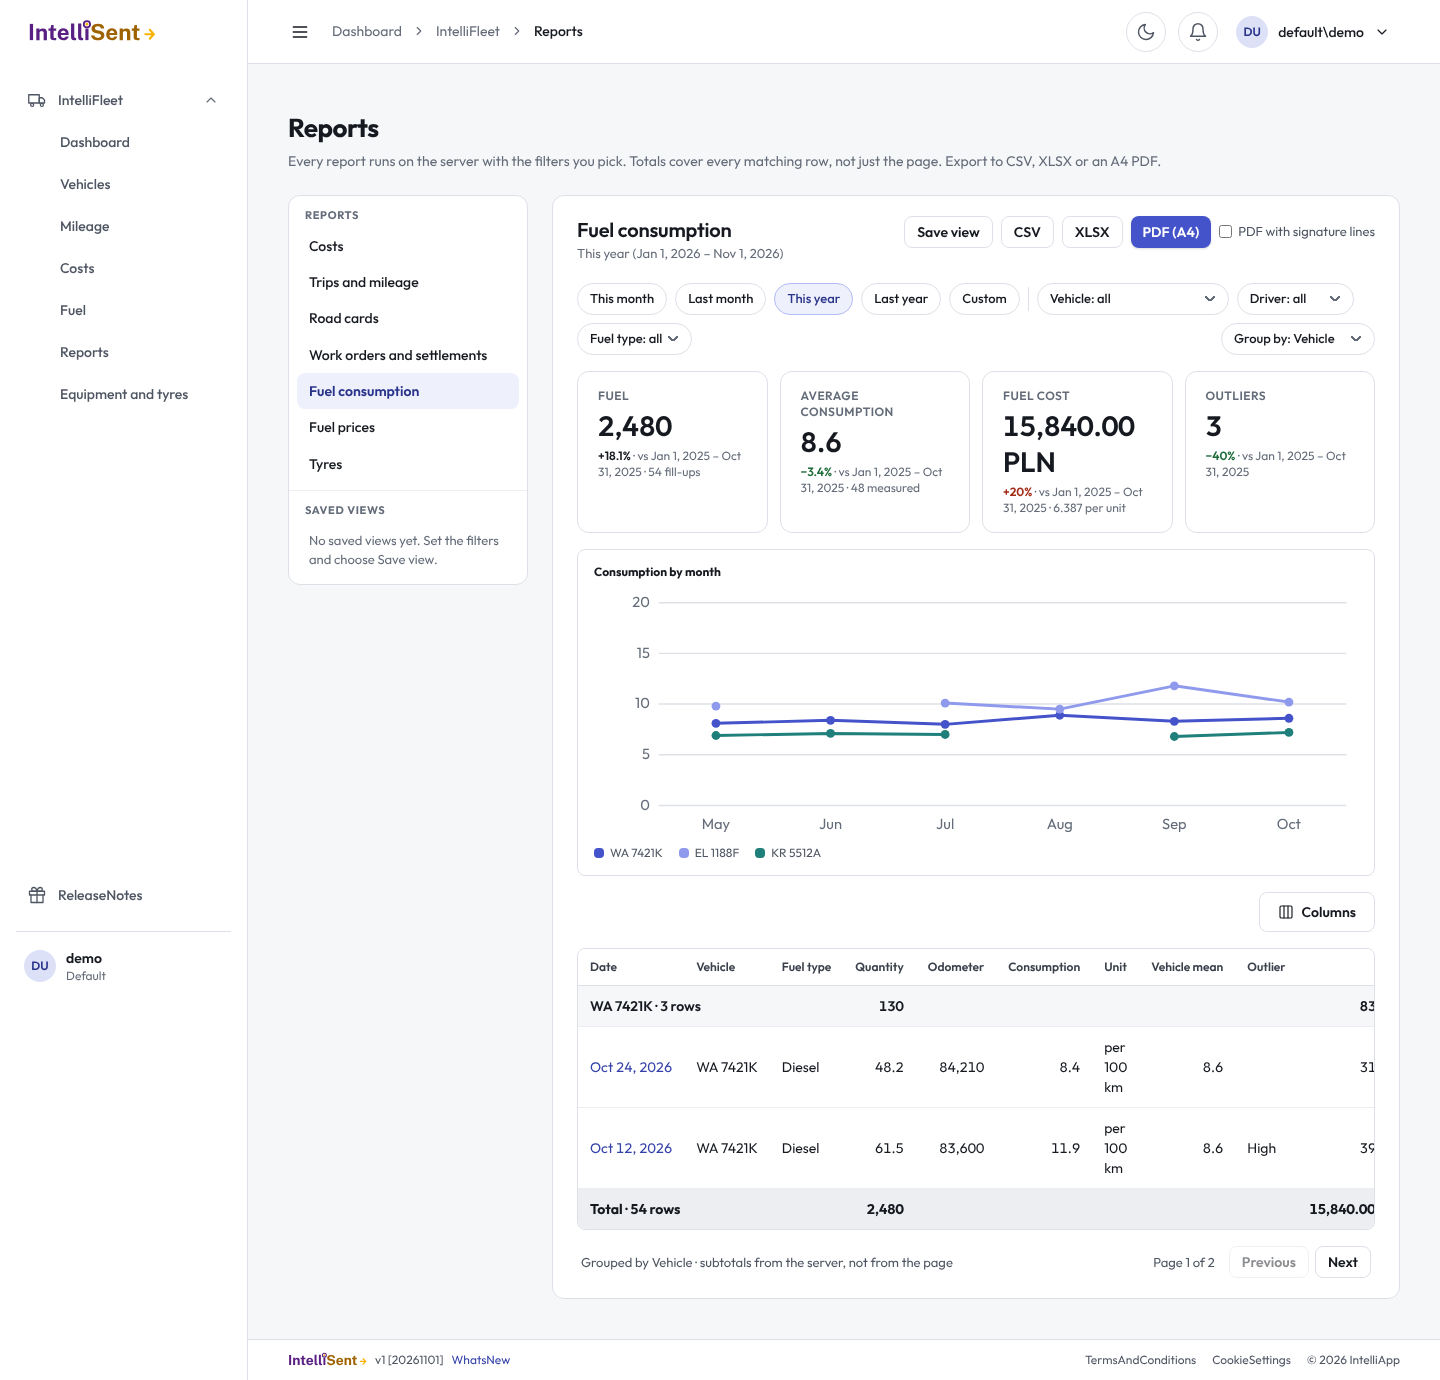
Fuel consumption lists the fuel entries of the period with the consumption of each full-tank fill-up, the way the Fuel screen works it out: the fuel added since the vehicle's previous full tank divided by the kilometres between the two. The unit follows the vehicle: per 100 km, per 100 miles, or per engine hour for a vehicle that counts hours. A part-tank fill-up has no figure of its own and counts toward the next full tank. The tiles show the Fuel quantity, the Average consumption, the Fuel cost (with the average price per unit) and the number of Outliers; the chart draws a line per vehicle (the four with most measurements) with the monthly average, with a gap where a month has no measurement.
Outliers: when a vehicle has at least three measured fill-ups in the rows shown, any fill-up whose consumption is more than 25% above or below the vehicle's mean is flagged High or Low, and the table shows the vehicle's mean and the deviation. Narrow the period or the filters and the means change with them. Filter by vehicle, driver, fuel type and currency. Needs the Fuel permission.
Fuel norm: a vehicle with a fuel norm (on its card) is judged by it instead of the 25% rule: the Norm column shows it (per 100 km or per hour, for the vehicle's primary fuel), and a measured fill-up over the upper limit or under the lower one gets Above norm or Below norm in the Norm flag column. The Above norm tile counts the first kind, and the Norm filter keeps only the fill-ups above or below the norm. A vehicle without a norm shows neither and keeps the outlier rule.
Fuel prices
Fuel prices lists the company's price list (a station's or place's gross price per unit on a day) for the period. The tiles show the Average price, the Lowest, the Highest and the Latest price; the chart draws a line per fuel type with the monthly average price. The price list belongs to the company, so the branch, fleet and vehicle filters do not apply; filter by fuel type and currency. Needs the Fuel permission.
Tyres
Tyres is the tyre register as it stands today, so it has no period. Each tyre set shows its inventory number, brand, season, size, number of tyres, where it is (On a vehicle, In storage or Not placed), when it was last mounted, the kilometres it has run since then (the vehicle's latest odometer reading minus the odometer at mounting) and, when the set has a mileage limit, how much of it is worn. The tiles show the Tyre sets (with the number of tyres), how many are on vehicles and in storage, how many are At the limit (100% worn or more) and the Purchase value; the chart counts sets per season, split by place. Filter by place, season, vehicle and currency. A set on a vehicle is seen when the vehicle is; a set on no vehicle is the company's, unless the branch, fleet or vehicle filters narrow the report. A row opens the vehicle's card. Needs the Equipment and tyres permission.
From the vehicle and employee cards
The Costs tab of a vehicle's card and the employee card have a Costs report link. It opens the report for that vehicle or that driver.
More reports
The annual summary, cost per vehicle (TCO), the branch and fleet comparison and invoice allocation are described in Annual summary, cost per vehicle and comparisons.
The repairs and damages, due-date, registers, faults, compliance and handover reports are described in Reports: repairs, due dates, registers, faults, compliance and handovers.